
Table 2.
Activation-accuracy relationship.
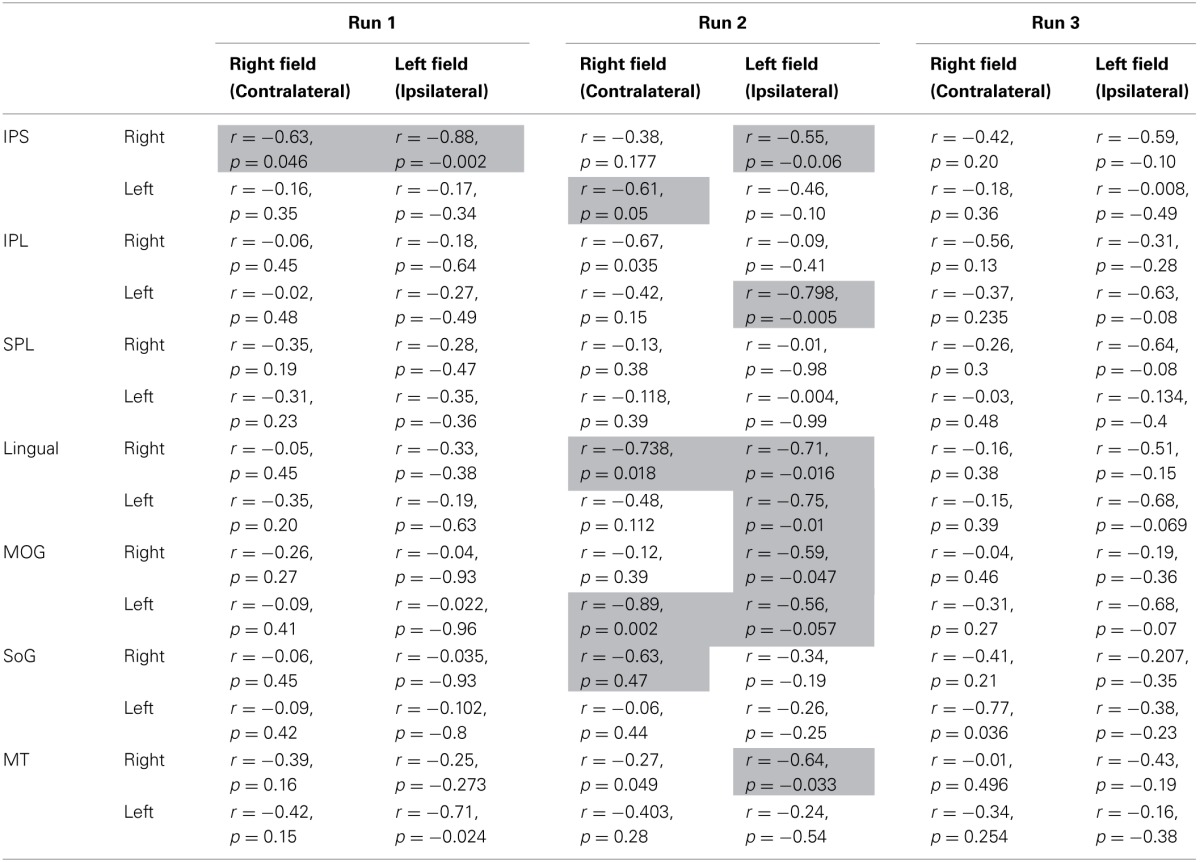
Results of Pearson's correlation between normalized activation of a region (volume of activation following rTMS vs. sham) and normalized accuracy in a hemifield (accuracy following rTMS vs. sham). The relationships are presented for ROIs identified in multi-subject analysis. These ROIs were tested subject-by-subject and the resultant volume that was active following rTMS vs. sham was analyzed for correlation with their accuracy in the right and left hemifields. Significant correlations or trends toward significance have been highlighted in gray. Although a few other regions appeared to have a significant relation, for instance left MT with left field accuracy in Run 1, on close analysis, these correlations were removed as they were driven by individual outlier values.