
Fig. 1.
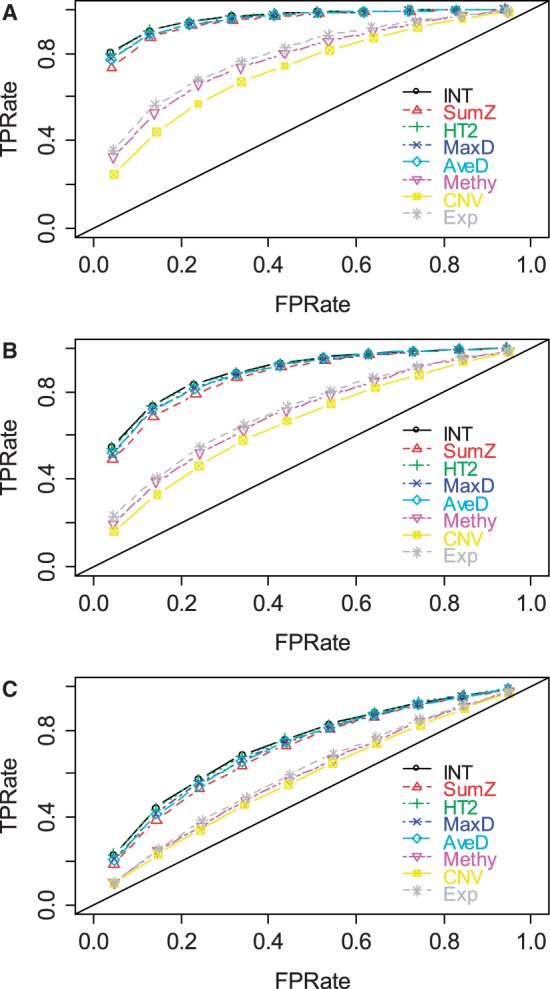
ROC plots for gene set methods at different α levels [(A) α = 75%; (B) α = 50%; and (C): α = 25%]. The simulated data were generated with β = 0.8 and η = 0.91
Official websites use .gov
A
.gov website belongs to an official
government organization in the United States.
Secure .gov websites use HTTPS
A lock (
) or https:// means you've safely
connected to the .gov website. Share sensitive
information only on official, secure websites.
ROC plots for gene set methods at different α levels [(A) α = 75%; (B) α = 50%; and (C): α = 25%]. The simulated data were generated with β = 0.8 and η = 0.91