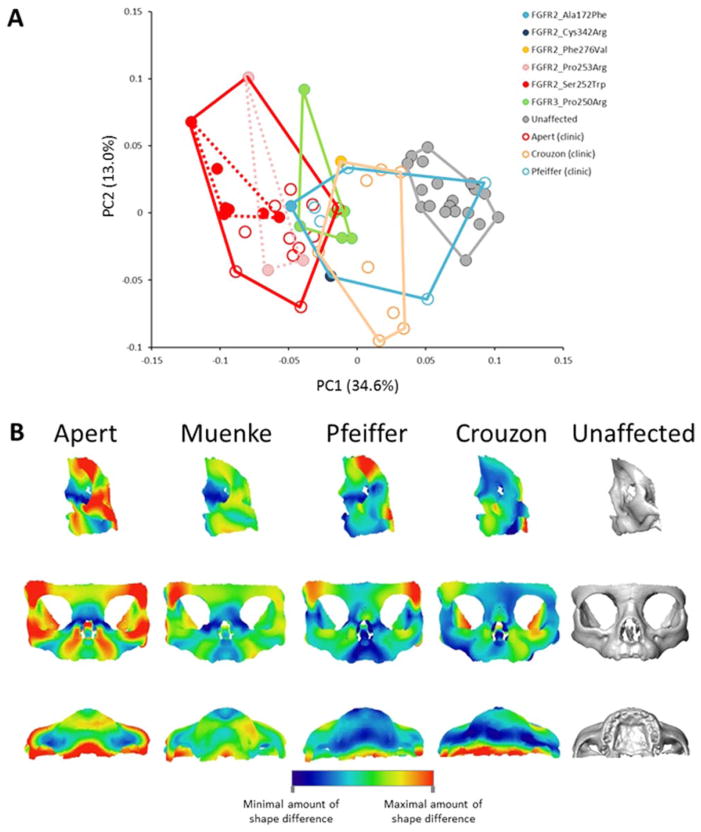
FIGURE 2.
Facial phenotypic variation of patients genetically and/or clinically diagnosed with AS, CS, MS, or PS. A: Placement of the syndromic cases and unaffected individuals on PC1 and PC2 in the shape space (principal components analysis of the Procrustes shape coordinates) when analyzing all landmarks and semilandmarks measured on the facial skeleton. Filled circles: patients genetically diagnosed; open circles: patients clinically diagnosed. B: Lateral, anterior and inferior views of the mean shape differences between the facial skeleton of AS, MS, PS, CS and unaffected individuals. Colors represent the magnitude of shape differences between the consensus shape (PAS) of each syndrome (AS, MS, PS, or CS) and the unaffected PAS computed as the difference of the vertex positions of corresponding vertices in both triangular meshes.

