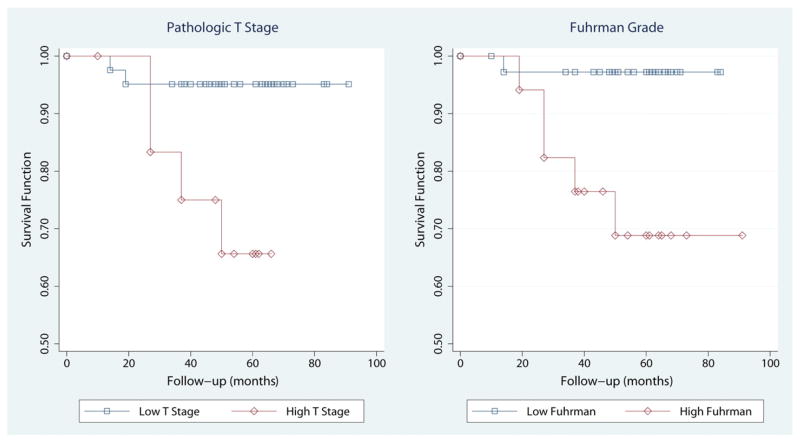
Fig. 3.
Survival curves using the Kaplan-Meier method for cancer-specific mortality by pathologic T stage (left panel) and Fuhrman grade (right panel). Pathologic T stages were grouped in high (≥T3a) and low (≤T2b) categories. Fuhrman grades were grouped in high (3 and 4) and low (1 and 2) categories. Using these groups, survival functions, compared by the log-rank test, were significantly different for pathologic stage (P = .009) and Fuhrman grade (P = .005).

