
Figure 1.
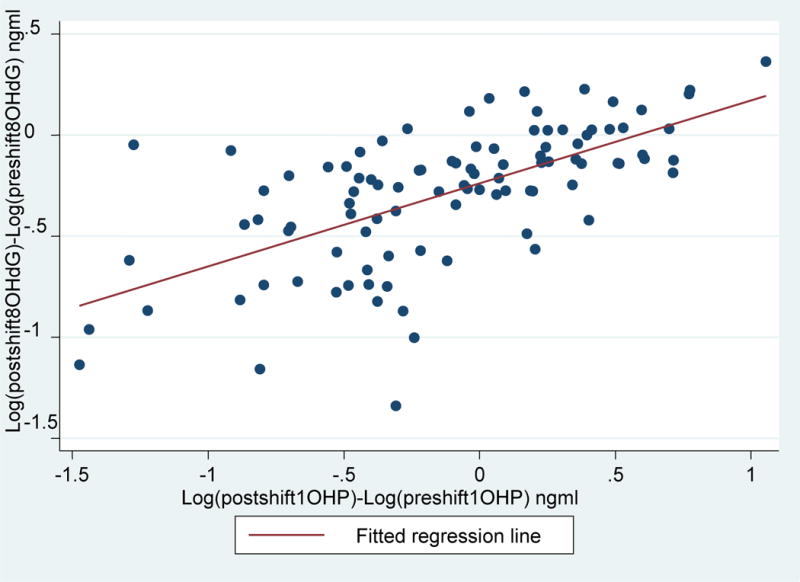
Relationship of post-shift and pre-shift differences of log[8OHdG] (ng/ml) on the y-axis and post-shift and pre-shift differences of log[1-OHP] (ng/ml) on the x-axis. Log[8OHdG]= −0.24+ Log(1-OHP)*0.41; R2=0.41, p<0.001
Official websites use .gov
A
.gov website belongs to an official
government organization in the United States.
Secure .gov websites use HTTPS
A lock (
) or https:// means you've safely
connected to the .gov website. Share sensitive
information only on official, secure websites.
Relationship of post-shift and pre-shift differences of log[8OHdG] (ng/ml) on the y-axis and post-shift and pre-shift differences of log[1-OHP] (ng/ml) on the x-axis. Log[8OHdG]= −0.24+ Log(1-OHP)*0.41; R2=0.41, p<0.001