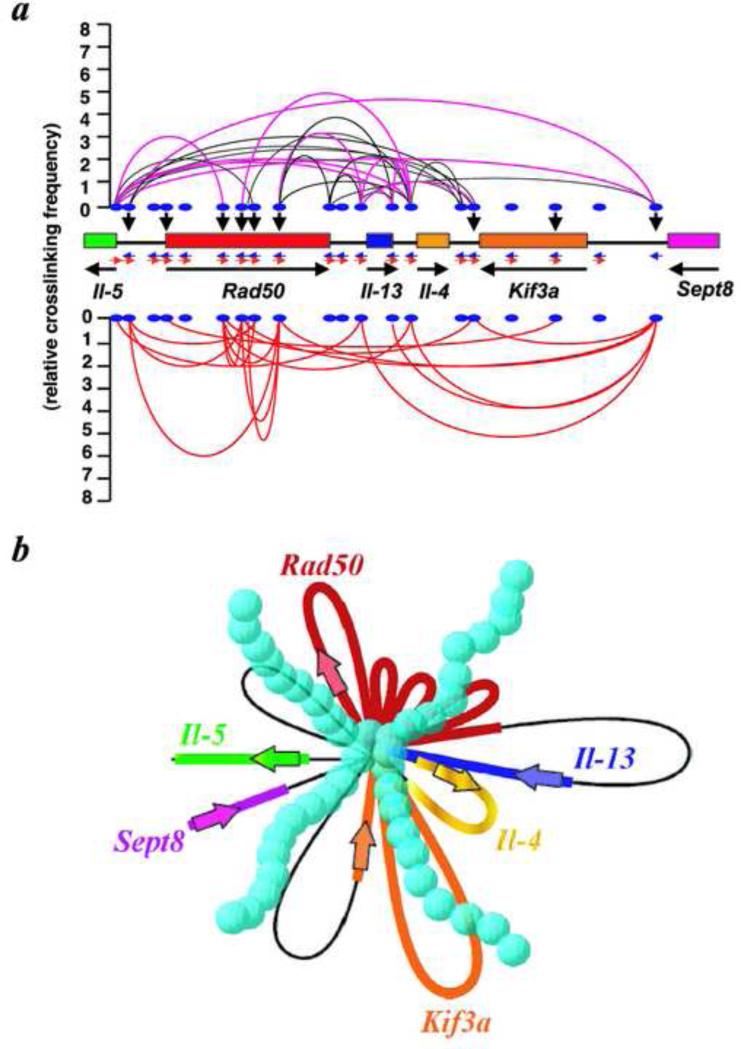
Figure 6.
A three-dimensional, transcriptionally-active complex containing dense looping. a, Summary of 3C and ChIP-3C assays of the cytokine regions in resting and activated D10.G4.1 cells. Black lines connecting two positions indicate juxtaposition of these sites in resting cells. Pink lines represent two positions that show much increased cross-linking frequencies after activation. Red lines represent two positions that are newly brought into close proximity upon activation. Black vertical arrowheads show direct Satb1-binding sites. The cross-linking frequency for each ligation product generated between any two positions is represented by the peak of the parabola connecting the positions. b, A schematic diagram based on the looping events shown in a, assuming that all looping events can occur in a single cell. In this model, all small loops converge onto a common core base bound to Satb1 (blue spheres). As a consequence, the total physical volume of the active transcriptional complex is reduced, enhancing the accessibility of factors to genomic sites.

