
Figure 1.
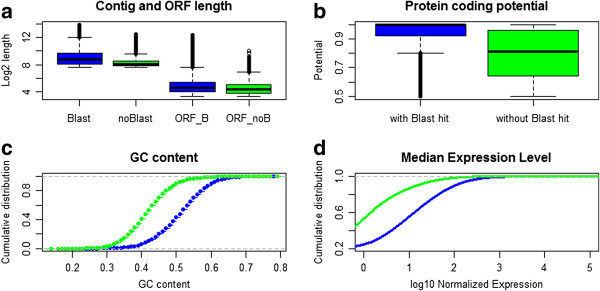
Comparison between the contigs with BLAST-hits and the set of contigs without BLAST-hits. a) Overall length and ORF length, b) Protein coding potential determined by CPAT, c) GC content per contigs, d) Overall normalized expression.
Official websites use .gov
A
.gov website belongs to an official
government organization in the United States.
Secure .gov websites use HTTPS
A lock (
) or https:// means you've safely
connected to the .gov website. Share sensitive
information only on official, secure websites.
Comparison between the contigs with BLAST-hits and the set of contigs without BLAST-hits. a) Overall length and ORF length, b) Protein coding potential determined by CPAT, c) GC content per contigs, d) Overall normalized expression.