
Figure 2.
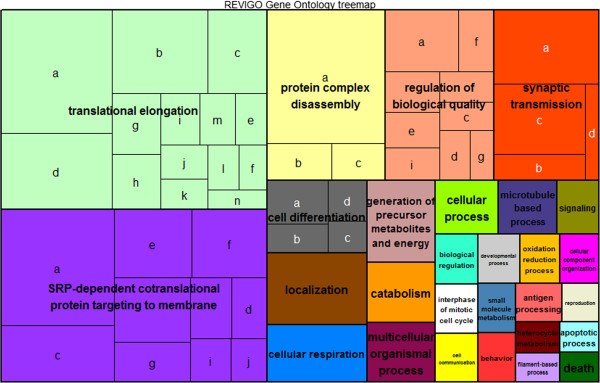
Gene Ontology treemap for the 1% highly expressed genes regardless of phenotype. The box size correlates to the –log10 p-value of the GO-term enrichment. Boxes with the same color can be grouped together and correspond to the same upper-hierarchy GO-term which is found in the middle of each box. Description of letters can be found in Additional file 1: Table S2.