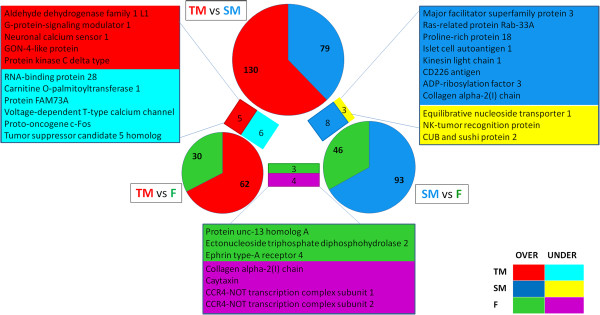
Figure 5.
Venn diagram of the three comparisons: territorial male versus sneaker male (TM vs SM), territorial male versus female (TM vs F) and sneaker male versus female (SM vs F). The circle size is scaled to the number of differentially expressed genes for each comparison. Bars between piecharts and the corresponding gene lists identify contigs which are significantly expressed in the two adjacent comparisons and therefore representative of one phenotype. These genes are presented in the squares boxes and the colors identify over or under expressed in the different phenotypes. In red is the elevated expression in territorial male, in blue elevated expression in sneaker male and in green elevated expression in female. Significant expression at lower levels in territorial males is shown in turquoise, pink are the genes expressed at lower levels in females and yellow are expressed at lower levels in sneaker males.

