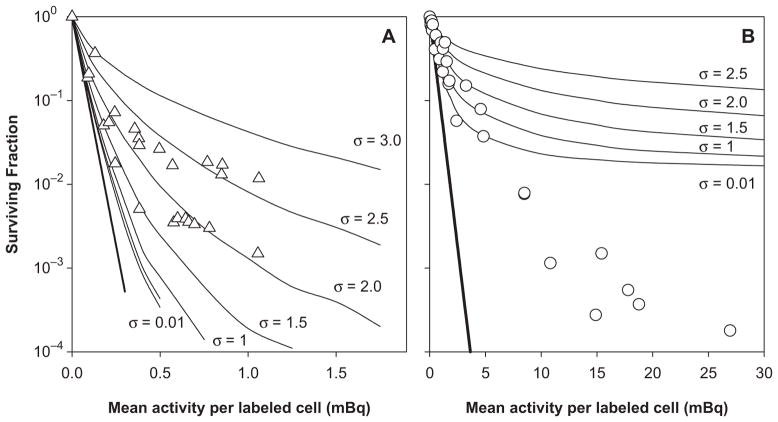
Figure 2.
Surviving fraction of V79 cells in multicellular clusters containing 4 × 10⁶ cells as a function of mean activity per labeled cell. Response curves are shown when 10% (Panel A) or 1% (Panel B) of the cells were labeled with 210Po-citrate. Theoretical survival curves are represented by the solid curves where the lognormal shape parameter was varied from σ = 0.01 to σ = 3.0, representing the span from a uniform distribution to a broad lognormal distribution. These theoretical curves are overlaid on published experimental cluster data that were obtained when 10% (△) or 1% (○) of the cells were labeled (Neti and Howell 2007). Each set of symbols represent the collective data for three independent experiments (Neti and Howell 2007). Error bars (SEM) for the experimental values are of the order of the dimensions of the symbols representing the data points. The straight bold-solid lines represent the response when the activity was assumed to be uniformly distributed throughout the cone.

