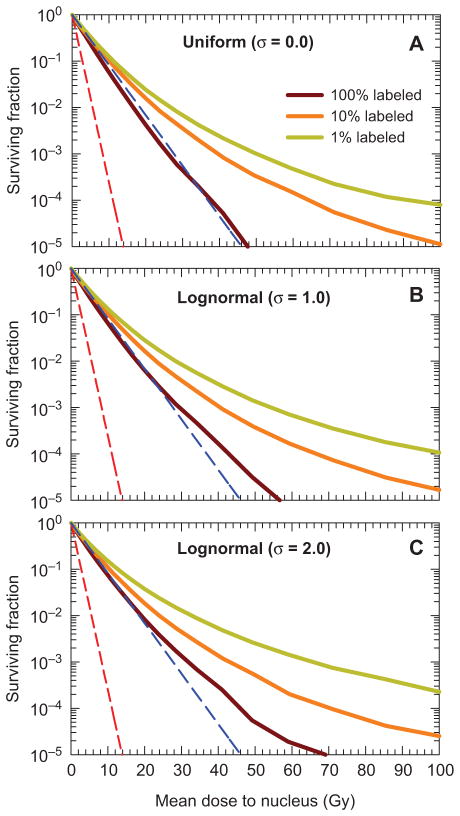
Figure 3.
Surviving fraction as a function of mean absorbed dose to the cell nucleus, obtained with the theoretical Cytomatrix™ model wherein cells are labeled with a hypothetical radionuclide that emits 100 keV electrons. Dependence of survival curve on percentage of cells labeled (100%, 10%, or 1%). Three different activity distributions among the labeled cells are considered: (A) uniform, (B) lognormal with σ = 1.0, and (C) lognormal with = 2.0. The red and blue dashed lines represent exponential survival curves with D37 = D37,self = 1.2 Gy and D37 = D37,cross = 4.0 Gy, respectively.

