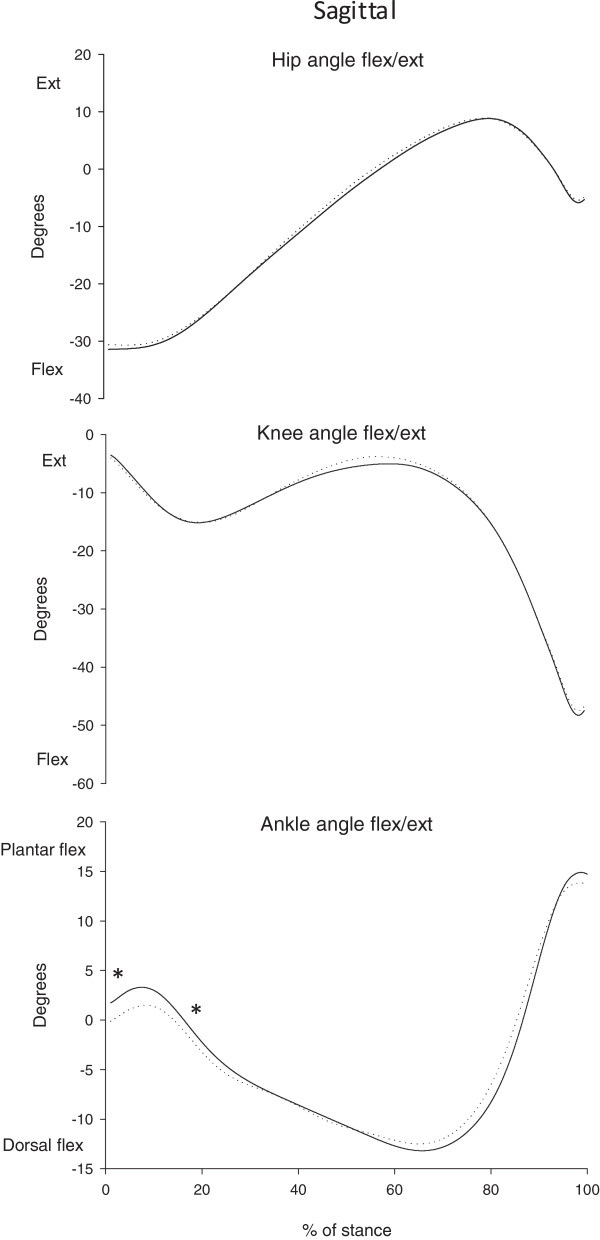
Figure 2.
Joint angles. Mean joint angles for the two groups of children, in the sagittal plane and for right/hypermobile leg, i.e. hip, knee and ankle during stance. The duration of the stance phase is normalized to 100%. Solid lines are children with generalized joint hypermobility (GJH) and dotted lines represent the healthy control children (NGJH). Asterisks indicate significant between-group differences (p-values <0.05).

