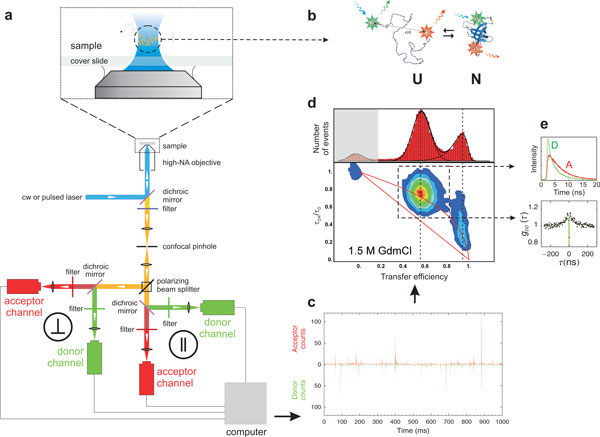
Figure 2.
Overview of instrumentation and data reduction in confocal single-molecule spectroscopy. (a) The scheme illustrates the main components of a 4-channel confocal single molecule instrument that collects fluorescence photons separated by polarization and wavelength and records their individual arrival times. (b) Illustration of a FRET-labelled protein present in solution in an equilibrium between folded and unfolded states. (c) Small part of a binned trajectory of detected photons recorded from molecules freely diffusing in solution (in this example CspTm in 1.5 M GdmCl [13]), where each fluorescence burst corresponds to an individual molecule traversing the diffraction-limited confocal volume. (d) Transfer efficiency histogram and 2-dimensional histogram of the relative donor fluorescence lifetime, τDA/τD, versus transfer efficiency, E, calculated from individual bursts, resulting in subpopulations that can be assigned to the folded and unfolded protein, and molecules without active acceptor at E ≈ 0 (shaded in grey). The straight and curved red lines correspond to the relation between τDA/τD and E expected for the case of a single fixed distance (Eq. 6) and the broad distance distribution of a Gaussian chain [13], respectively. (e) Subpopulation-specific time-correlated single photon counting histograms for donor and acceptor photons from all bursts assigned to unfolded molecules, and subpopulation-specific donor intensity correlation function, in this case reporting on the nanosecond reconfiguration dynamics of the unfolded protein.

