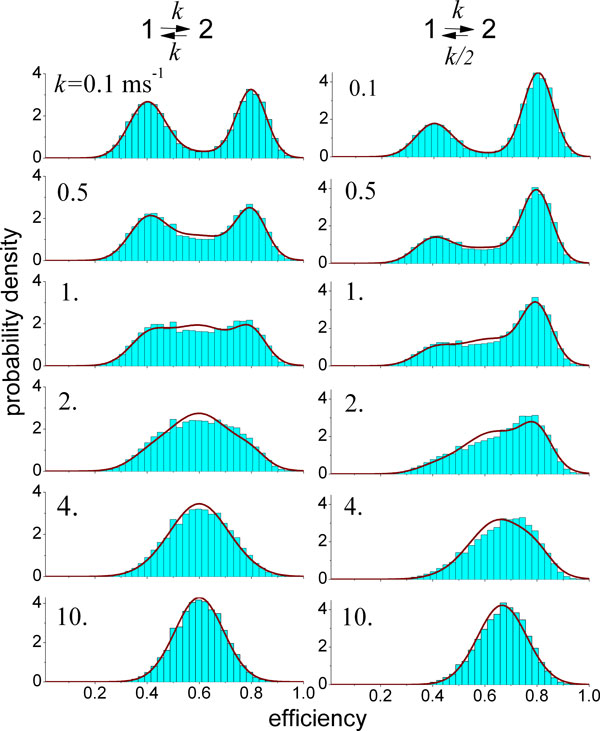
Figure 3.
Effects of conformational dynamics on transfer efficiency histograms in single-molecule FRET experiments on freely diffusing molecules. The histograms (blue bars) were calculated assuming that the molecules in the sample undergo transitions between two conformational states with low (E1 = 0.4) and high (E2 = 0.8) transfer efficiency. The histograms are shown for different values of the transition rate, given in the upper left corner of the histogram. In the first column, the equilibrium populations of two the states are equal; in the second column, the populations differ by a factor of 2. For low values of k, two well-separated peaks are observed, corresponding to the two subpopulations. With increasing relaxation rate, it becomes more likely that a conformational transition occurs during a transit of the molecule through the confocal volume (and thus a fluorescence burst), resulting in an increasing number of events with apparent transfer efficiencies in the range between the true transfer efficiencies E1 and E2. At high relaxation rates, transitions occur so frequently during a fluorescence burst that the two subpopulations become indistinguishable; only one peak remains, whose relative position between E1 and E2 is determined by the equilibrium constant. The histograms are compared to the Gaussian approximation [20] (red lines), which can also be used to determine rate constants from measured histograms[19]. Figure provided by Irina Gopich [79].

