
Figure 4.
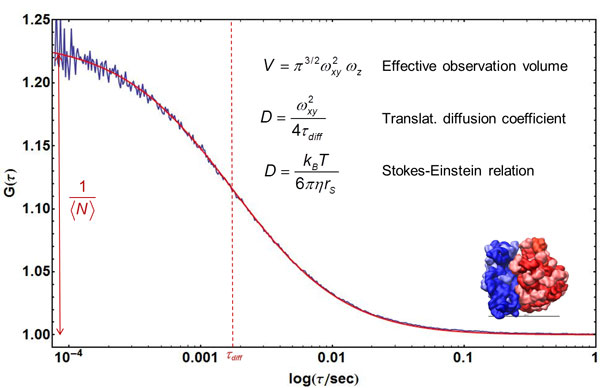
Quantifying translational diffusion with FCS. An FCS curve of fluorescently labelled ribosomes freely diffusing in solution (blue) is shown with a fit using Eq. 13 (omitting the exponential term; data by J. Clark & B. Schuler, unpublished). From the amplitude of the correlation function, the average number of fluorescent particles in the confocal volume, 〈N〉, can be determined. With knowledge of the size of the confocal volume, V, based on its half-width, ωxy, and height, ωz, the particle concentration can be calculated. From the diffusion time, τD, the translational diffusion coefficient, D, of the particles is obtained, which can be related to the Stokes radius, rs, via the Stokes-Einstein relation (where kB is Boltzmann's constant, T is temperature, and η is the solution viscosity). The inset shows a structural representation of the ribosome (rs ≈ 12 nm).