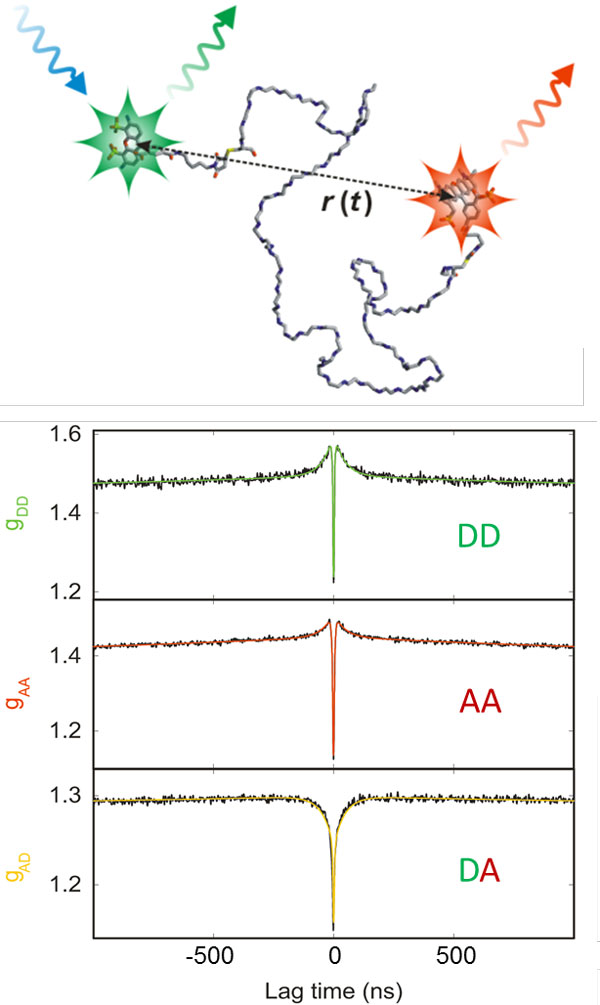
Figure 6.
Nanosecond correlation spectroscopy used for the determination of unfolded state dynamics on the sub-microsecond timescale. (top) Cartoon of a FRET-labelled unfolded protein undergoing diffusive chain dynamics, resulting in fluctuations of the inter-dye distance, r(t) [12]. (bottom) Donor-donor (DD), acceptor-acceptor (AA), and donor-acceptor (DA) intensity correlation functions for an unfolded protein are shown (CspTm in 4 M GdmCl [96]) in the nanosecond range, where the decay at about 50 ns reports on the reconfiguration time of the polypeptide chain. Note that the donor-acceptor crosscorrelation shows anticorrelated behaviour, a signature of distance dynamics. Antibunching [112] occurs on the timescale of a few nanoseconds. Fits are shown as solid lines [96].

