Figure 8.
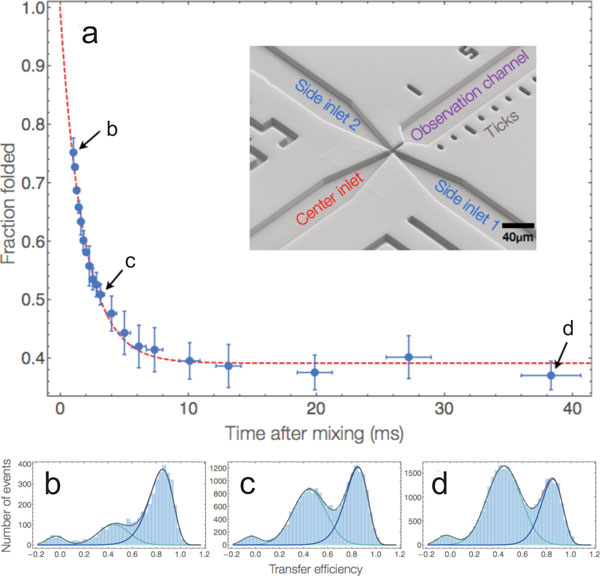
Microfluidics for probing nonequilibrium dynamics with single-molecule spectroscopy. The millisecond unfolding kinetics of a small protein (BdpA) upon mixing with denaturant are shown as an example for the application of microfluidics [115]. Folded BdpA in the centre inlet was mixed with 3.3 M of the denaturant GdmCl from the side inlet channels to trigger unfolding (see inset for an electron micrograph of the microfluidic structure in the mixing region of the device). (a) The fraction of folded population (blue data points) was determined from fits to the corresponding transfer efficiency histograms (solid lines in b-d) and plotted as a function of time after mixing. The data were fit with a single exponential decay (dashed red line). (b-d) Representative transfer efficiency histograms measured at the positions indicated in (a). Figure adapted from ref. [115].

