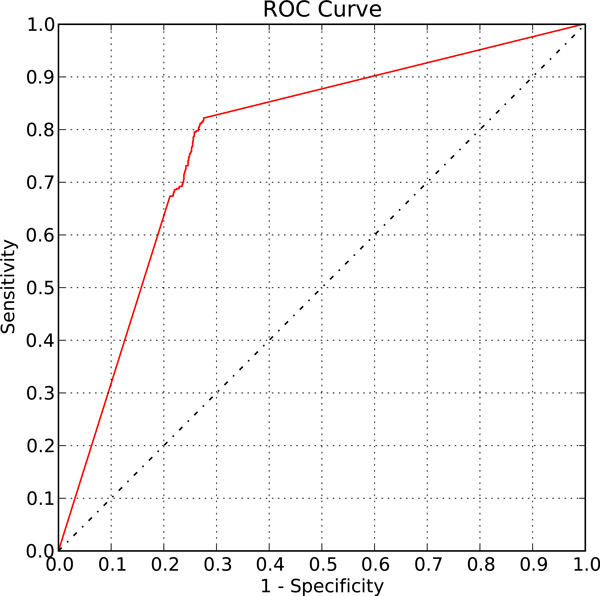
Figure 3.
The ROC curve of the validation on the ground truth set for Saccharomyces cerevisiae. When applied to the control set for S. cerevisiae, our method can distinguish functional binding targets from non-functional binding pairs, shown by the upper left corner trend on the ROC curve plot with AUC= 0.78. The ground truth set consists of 484 literature-curated functional TF-gene binding pairs as the positive control set and 1516 random TF-gene pairs as the negative control set.

