
Figure 3.
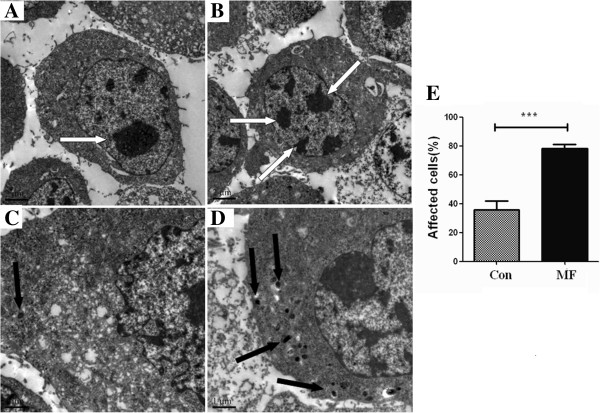
LF-MF alters the utrastructure of B16-F10 cells. Cell ultrastructure of B16-F10 cells exposure to Sham LF-MF, original magnification (A) 500×; (C) 1000×; Cell ultrastructure of B16-F10 cells exposure to LF-MF, (B) 500×; (D) 1000×. Cells were observed by transmission electron microscopy. Percentage of positive cells in every 500 cells were counted (E). Compared with control cells, the treated cells were characterized by the breaking down of chromatin (white arrow) and black granule accumulation (black arrow).