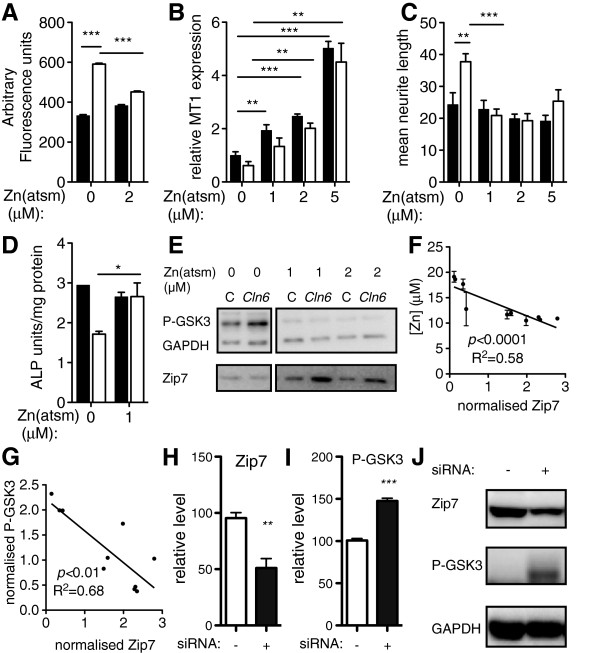
Figure 6.
Delivery of bioavailable Zn restores Zn-dependent phenotypes through upregulation of Zip7. (A) Labile Zn in control (black bars throughout) and Cln6 (white bars throughout) cortical neurons after 1 h ZnII(atsm) treatment was measured by FluoZin-3 fluorescence (N = 3). (B)MT1A mRNA expression after 1 h ZnII(atsm) treatment in cortical neurons was assessed using qRT-PCR (N = 3). (C) Neurite length in control and Cln6 primary cortical neurons treated for 1 h with ZnII(atsm) was determined by tubulin immunofluorescence. Images (>1,000 cells/well from 4 experiments) were taken using the ArrayScan High Content Platform and analysis was performed using Neuronal Profiling software (refer to Additional file 1). (D) ALP activity in control and Cln6 primary mouse astrocytes was determined after 1 h ZnII(atsm) treatment (N = 3). (E) ZnII(atsm)-dependent regulation of P-GSK and Zip7 levels after 4 h treatment was assessed in primary mouse astrocytes by western blotting. Images are from different lanes on the same gel. (F-G) Normalized Zip7 protein levels in Merino sheep occipital lobe were plotted against normalized levels of Zn (F) and P-GSK (G) to determine correlations between these proteins (N = 3 sheep per genotype). Linear regression analysis was performed in GraphPad Prism. (H-J) Zip7 knockdown results in hyperphosphorylation of GSK3. 100nM negative control siRNA (-) or Zip7 siRNA (+) was transfected into mouse NIH 3T3 cells. Zip7 (H) and P-GSK3 (I) protein expression was determined by Western blotting and normalized to expression of GAPDH. Data are expressed as mean + SEM values. *p < 0.05, **p < 0.01, ***p < 0.001 by Student’s t test. (J) Images are representative of 3 independent experiments.

