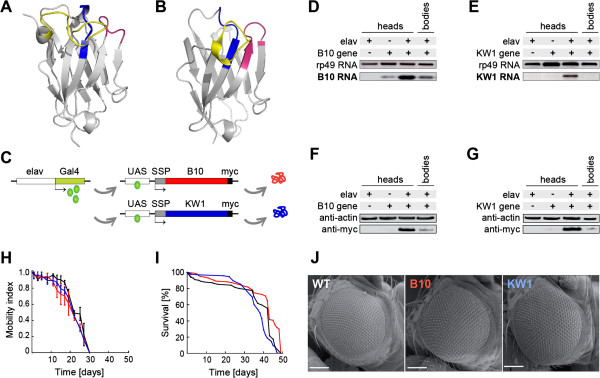
Figure 1.

B10 or KW1 do not noticeably affect the fly phenotype when expressed without Aβ. (A, B) Ribbon diagrams of the crystal structures of B10 (A) and KW1 (B), according to protein data base entries 3LN9 and 3TPK [29,31]. The complementary determining regions (CDRs), that define the antigen binding sites, are coloured in blue (CDR1), red (CDR2) and yellow (CDR3). (C) Schematic representation of the expression constructs. The elav promoter drives the neuron-specific expression of Gal4 protein, which subsequently induces the neuronal expression of KW1/B10 through binding of an upstream acting sequence (UAS). (D, E) Reverse transcription polymerase chain reaction with head and body (thorax and abdomen) homogenates from different fly lines probed for transcription of B10 (D) or KW1 mRNA (E). Constitutively transcribed rp49 mRNA serves as a loading control. (F, G) WB shows a strong myc-positive band in B10 (F) and KW1 flies (G) at ~17 kDa molecular weight. Actin staining serves as a loading control. (H-J) Phenotypic comparison of B10 (red), KW1 (blue) and WT flies (black). (H) Locomotive assay. Error bars present standard deviation from three independent experiments using 15 flies each. (I) Viability assay. (J) Scanning electron microscopy images of the eyes. Scale bars represent 20 μm.
