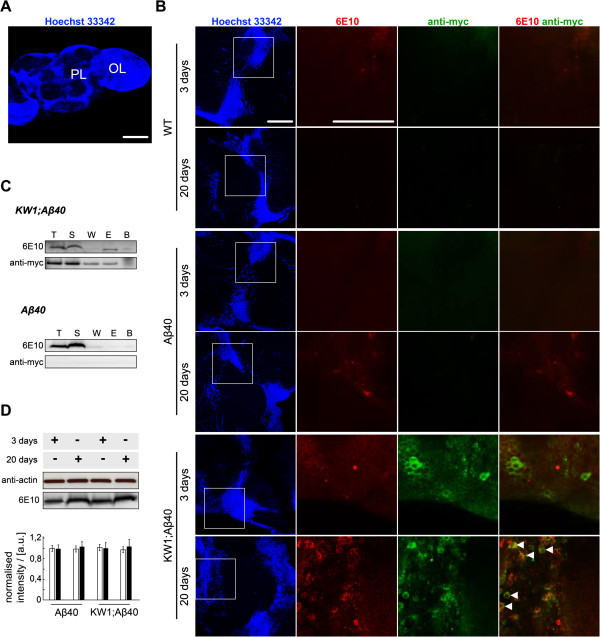
Figure 4.
KW1 interacts with Aβ(1–40) in fly tissue samples. (A) Immunofluorescence microscopy image of the protocerebral lobe (PL) and optical lobe (OL) regions of WT Drosophila brain stained with Hoechst 33342 to visualize cell nuclei. (B) IFM images of adult brains from 3-day and 20-day old WT (top), Aβ40 (middle) and KW1;Aβ40 flies (bottom). Left column (blue): Hoechst 33342 staining. White boxes indicate the regions enlarged in the following three columns. Second column (red): Aβ-staining with 6E10 antibody. Third column (green): anti-myc antibody staining of myc-tagged B10 or KW1. Right column: overlay of the anti-myc and 6E10 signals. Arrows indicate signal co-localisation. Scale bars represent 50 μm (A,B). (C) IP analysis of head homogenates from 20-day old KW1;Aβ40 and Aβ40 flies. Pull downs were performed against KW1. Resulting fractions were analyzed with WB to detect either Aβ (6E10) or myc-tagged KW1 (anti-myc). Abbreviations: T, total sample before IP; S, supernatant after incubation with beads; W, wash fraction; E, elution; B, beads after elution. (D) WB analysis with heads from 3-day and 20-day old Aβ40 and KW1;Aβ40 flies. Samples were probed with 6E10 to detect Aβ peptide (black bars). Anti-actin staining serves as loading control (white bars). All bars are normalised to the 3 days old Aβ40 sample (n = 2).

