
Figure 2.
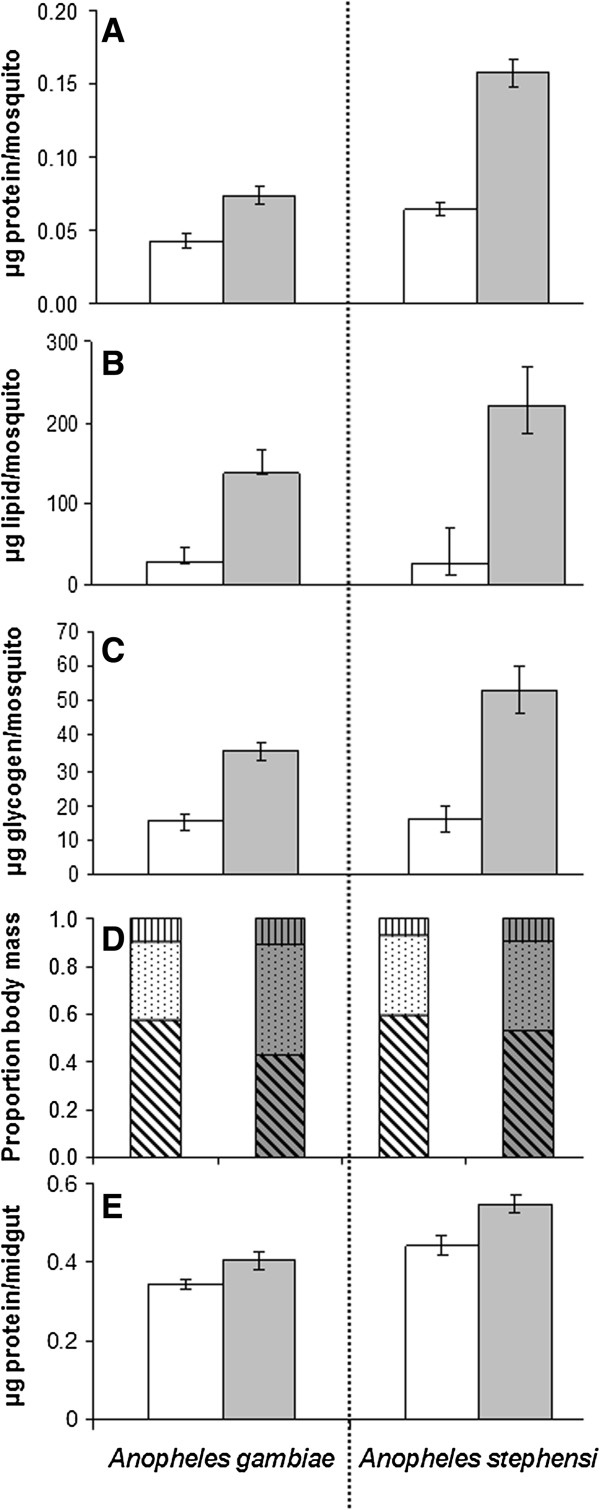
Effect in Anopheles gambiae (left) and Anopheles stephensi (right) of larval diet regime on total body reserves of protein (A) (n = 10 per treatment), lipid (B) (n = 30) and glycogen (C) (n = 10), on their relative proportion (D) upon emergence (means from A-C calculated as a proportion of dry weight, n = 28-48), and on blood meal size (E) (n = 10 except in low-diet An. gambiae, where n = 5). White background, low diet; grey background, high diet. In (D), vertical shading is glycogen, stippled shading is lipid and diagonal shading is protein. Error bars represent SEM.