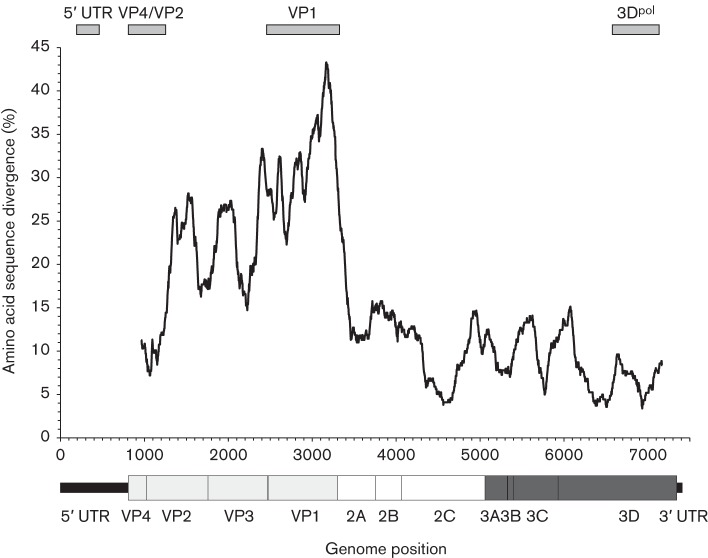
Fig. 2.
Amino acid sequence divergence across the genome of EV-G types 1–6. Divergence values were calculated using a window size of 300 bases, incrementing by a codon between windows. The genome diagram beneath is plotted to scale with the x-axis. Genome regions sequenced for recombination analysis (5′ UTR, VP4/VP2, VP1 and 3Dpol) are shown above the graph.

