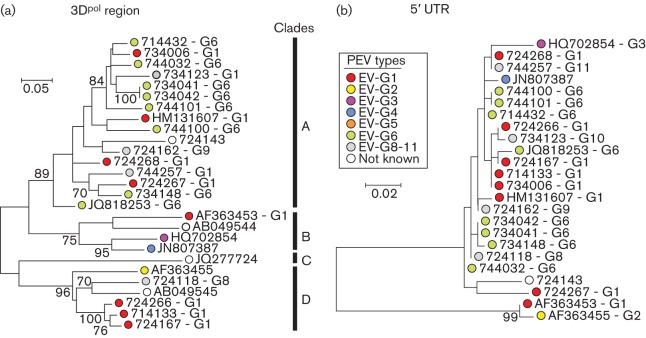
Fig. 3.
Phylogenetic comparisons of sequences from 3Dpol (nt 6585–7121) (a) and 5′ UTR (nt 196–470) (b) from the study samples and available sequences of other EV-G variants from GenBank. Maximum-likelihood trees were constructed from nucleotide sequences with 500 bootstrap resamplings to demonstrate robustness of groupings; values of ≥70 % are shown. The tree was drawn to scale; bar shows indicated evolutionary distance.

