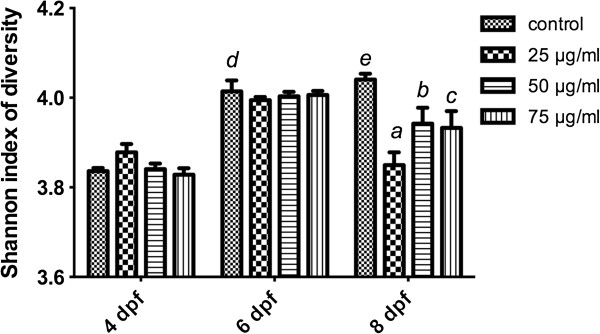
Figure 6.

Biodiversity of microbiota composition in zebrafish with TNBS-induced IBD. All error bars represent as mean ± SEM. n=6 samples per group, aIndicates a significant difference (p<0.05) between TNBS-exposed group (25 μg/ml) and the control, bIndicates a significant difference (p<0.05) between TNBS-exposed group (50 μg/ml) and the control, cIndicates a significant difference (p<0.05) between TNBS-exposed group (75 μg/ml) and the control, dIndicates a significant difference (p<0.05) between control groups at 6 dpf and 4 dpf, eIndicates a significant difference (p<0.05) between control groups at 8 dpf and 4 dpf.
