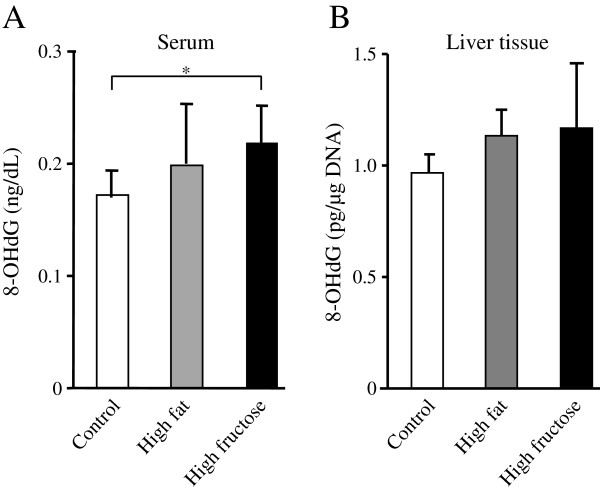
Figure 5.
Serum and liver tissue levels of 8-hydroxydeoxyguanosine (8-OHdG). (A) The serum 8-OHdG level differed significantly among the three groups (P = 0.03), and this level tended to be or was significantly higher in the high-fructose group than in the high-fat or control groups, respectively. Values are means ± standard deviation of 8 rats. *P <0.05. (B) The 8-OHdG level in liver tissue tended to be higher in the high-fructose group (n = 8) compared to that in the high-fat (n = 7) or control groups (n = 8).

