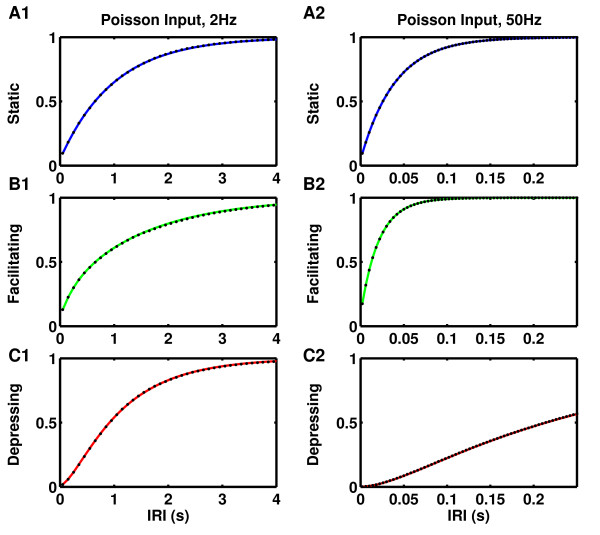
Fig. 2.
Cumulative distribution of inter-release intervals (IRIs) for the same curves shown in Fig. 1, verifying the remarkable agreement of the approximation used in Fig. 1b with the simulated data. a1–a2 Static synapses, . b1–b2 Facilitating synapses, , , . c1–c2 depressing synapses, , . a1, b1, c1 Presynaptic Poisson spike train of 2 Hz. a2, b2, c2 Presynaptic Poisson spike train of 50 Hz

