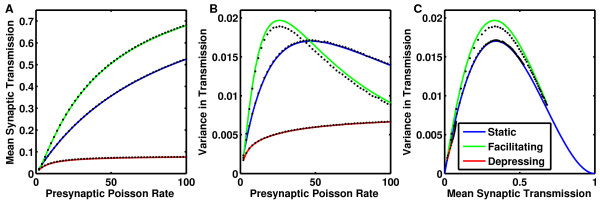
Fig. 3.

a Mean synaptic transmission, and b variance of synaptic transmission, , arising from presynaptic Poisson trains through probabilistic synapses. c Variance in synaptic transmission as a function of the mean transmission. Solid curves are analytic solutions (blue, middle curve for static, a= Eq. (23), b= Eq. (24), c= Eq. (25); green, upper curve for facilitating, a from Eqs. (20) and (31), b from Eqs. (22) and (31), c from a &b; and red, lower curve for depressing synapses, a= Eq. (26), b from Eqs. (4), (22), (25) and (27), c from a &b). Black dots are corresponding results from simulations produced by 30,000 sec of Poisson input spike trains through saturating synapses
