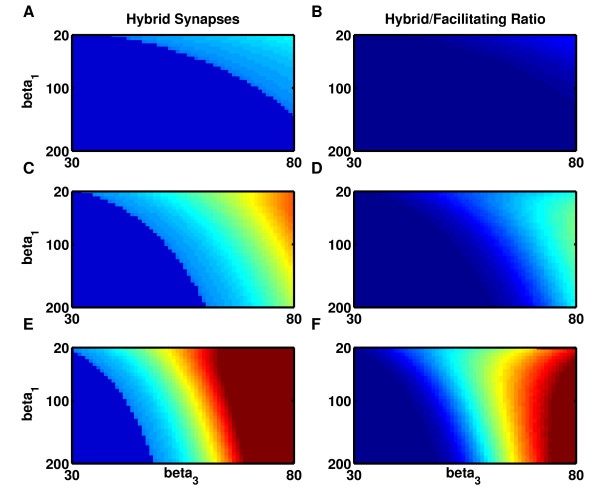
Fig. 7.
A hybrid model demonstrates the reduction in lifetime attributable to the enhanced fluctuations in postsynaptic conductance produced by synaptic facilitation. a–b Low threshold, . c–d Medium threshold, . e–f High threshold, . a, c, e Lifetime of states in the hybrid model with synaptic facilitation but with the noise due to static synapses. Dark blue: no bistability exists. Light blue = low stability; orange-red = high stability; cyan-green boundary = optimal lifetime of one hour. b, d, f Logarithm of the ratio of Figs. 7a, 7c, 7e to 6b, 6d, 6f, respectively, demonstrates the decrease in state lifetime attributable to enhanced noise when synapses are facilitating. Dark blue: ratio = 1. Cyan-yellow, ratio >e. Orange-light red, ratio . Dark red, ratio . All panels: Steepness of single neuron firing-rate curves increase with (y-axis) while maximum curvature increases with (x-axis). Stability of a bistable system is determined by the minimum lifetime of either of the two activity states. Maximum stability is calculated for each firing-rate curve as a function of connection strength and plotted after logarithmic scaling in color code

