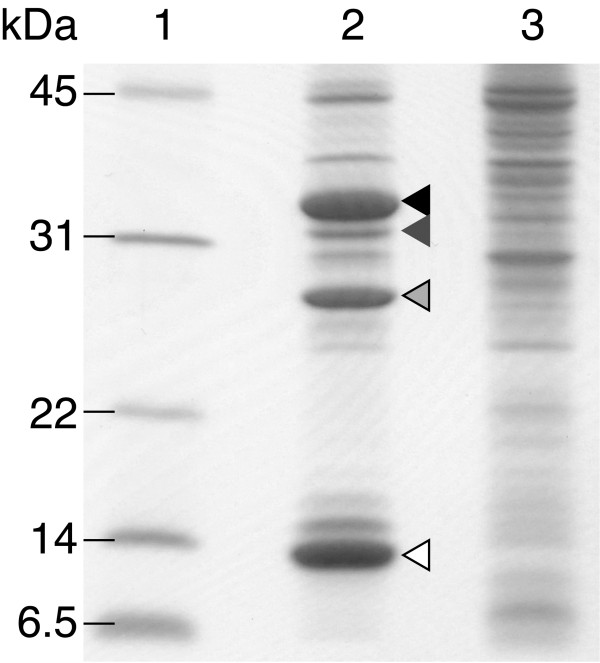
Figure 2.
SDS-PAGE analysis of soluble proteins in E. coli cells. Lanes 1, molecular mass standards with size indicated; 2, soluble protein of E. coli expressing heterologous genes; 3, soluble protein of E. coli (negative control). Triangles indicate as follows: filled, l-phenylalanine 4-hydroxylase; dark gray, glucose dehydrogenase; light gray, dihydropteridine reductase; open, pterin-4α-carbinolamine dehydratase.

