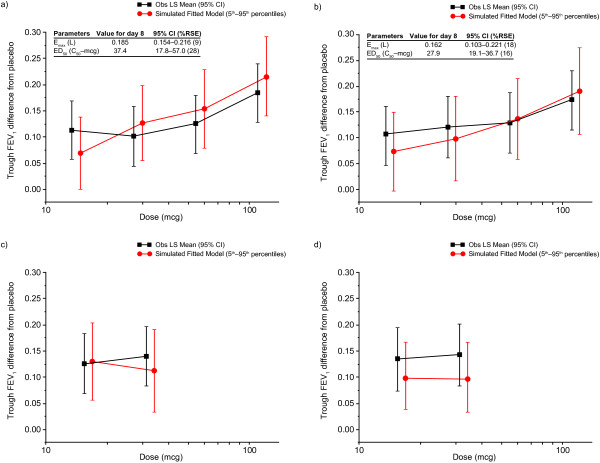
Figure 2.
Observed LS mean trough FEV1 and simulated fitted model for UMEC QD and BID regimens. Data are for (a) UMEC QD in the mITT population, (b) UMEC QD in the mITT population excluding patients from one investigator site, (c) UMEC BID in the mITT population, and (d) UMEC BID in the mITT population excluding patients from one investigator site. CI, confidence interval; ED50 (C50), dose that yields 50% of Emax; Emax, maximum predicted FEV1 response; FEV1, forced expiratory volume in 1 second; Obs LS, observed least square; RSE, relative standard error.

