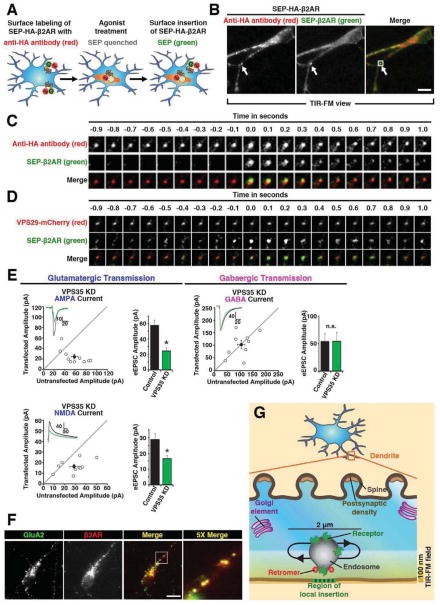
Figure 4. Retromer underlies local membrane insertion to the dendritic shaft and contributes to functional surface expression of glutamate receptors at synapses.
(A) Schematic of method for simultaneously labeling SEP-HA-β2AR surface insertion events and endosomes using SEP (green) and anti-HA (red) fluorescence. SEP puffs occur upon β2AR insertion to the plasma membrane while the red AlexaFluor conjugated to anti-HA is not significantly pH-dependent, revealing the adjacent receptor-containing endosome. (B) A frame from a representative TIR-FM image series of SEP and HA fluorescence, acquired using the scheme diagramed in panel A, simultaneous channel capture and a relatively ‘deep’ angle to illuminate a significant portion of ventral dendroplasm. A representative SEP puff is indicated by arrow. Scale bar = 10 μm. See also Movie S3. (C) Higher magnification view of multiple frames from the area indicated. (D) TIR-FM image series showing SEP puffs relative to retromer domains marked by VPS29-mCherry, acquired under similar conditions except using sequential imaging of paired channels at 20 Hz and a relatively ‘shallow’ angle to illuminate little ventral dendroplasm. See also Movie S4. (E) Electrophysiological analysis of VPS35 KD effects on AMPA, NMDA and GABA -mediated synaptic currents in hippocampal slice culture. Scatterplots show amplitudes of AMPAR and NMDAR eEPSCs and GABAAR eIPSCs for single pairs of neurons (open circles) and mean ± SEM (filled circles) across all neuron pairs collected. The scatterplots represent data obtained from slice cultures 6 days after transfection with the VPS35 shRNA - EGFP construct (current amplitude plotted on the ordinate) relative to an adjacent non-transfected neuron (current amplitude plotted on the abscissa). Insets show sample current traces from Control (black) and transfected (green) cells. Bar graphs summarize mean ± SEM AMPAR and NMDAR eEPSC and GABAAR eIPSC amplitudes represented in the respective scatterplots (*, p<0.05). (F) Labeling of overlapping endosomes by endogenous GluA2 and FLAG-β2AR, after co-incubation of neurons in dissociated culture with anti-GluA2 and anti-FLAG antibodies for 20 min in Neurobasal medium supplemented with 1 μM isoproterenol. (G) Schematic of an enlarged view of a dendrite showing the localization of different subcellular compartments relative to retromer-associated endosomes that move locally within a short range of 2 μm. Surface delivery of β2AR from endosomes to the plasma membrane occurs very locally relative to the retromer domain, and the retromer domain is located very close to the location of surface insertion because it is readily visualized in the TIR-FM illumination field and effectively overlaps the location of the retromer-associated endosome in x and y dimensions.

