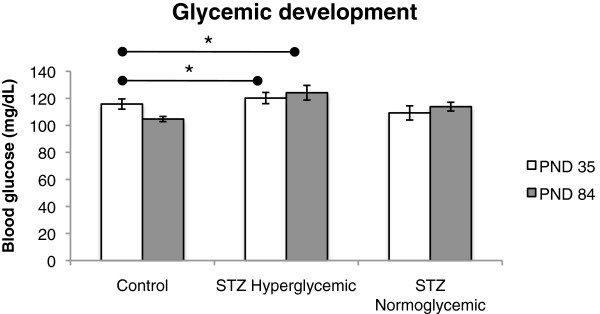
Figure 2.

Glycemia on PND 35 and 84 of Control (n = 10), STZ hyperglycemic (n = 6), and STZ normoglycemic (n = 6) rats. Values expressed as mean ± standard error of mean. Significant group effect, p < .05, and trend towards significant time and group interaction, p = 0.053. *p < .05, statistically significant difference compared with Control group (ANOVA followed by Tukey’s test).
