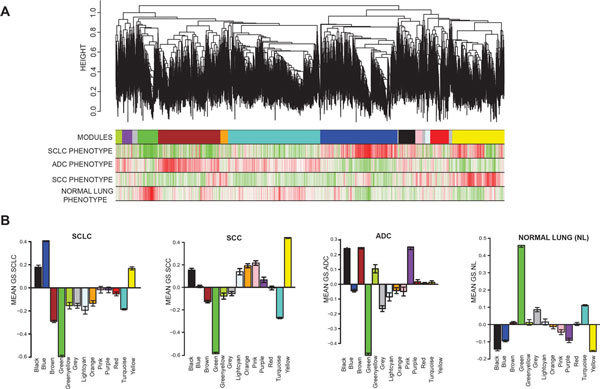
Figure 1.

Identification of SCLC-specific modules using WGCNA. (A) In the hierarchical dendrogram, lower branches correspond to higher co-expression (height = Euclidean distance). The 13 identified modules were coded by the colors indicated below the dendrogram. Below, red and green lines indicate positive or negative correlations, respectively, with lung tumor types on the left. (B) Average 'gene significance' (GS) of genes within a specific module summarized in the barplot for each lung tissue type (left to right: SCLC, SCC, ADC, and NL). The blue module is associated solely with SCLC.
