
Figure 3.
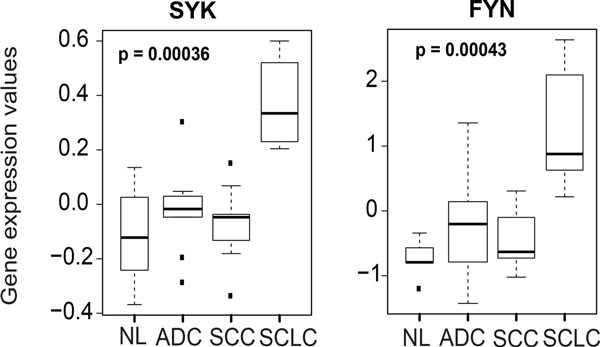
Co-expression of 2 SSHN kinases FYN and SYK in SCLC patients. Log2 expression values are indicated in the boxplots for each individual hub within SSHN across various patient lung tissues from the GSE6044 test dataset [9]. The outliers are denoted by dots. P-value shows statistical significance by Kruskal-Wallis nonparametric test [81]. FYN and SYK are co-overexpressed in SCLC patients versus NSCLC (ADC, SCC) and normal lung.