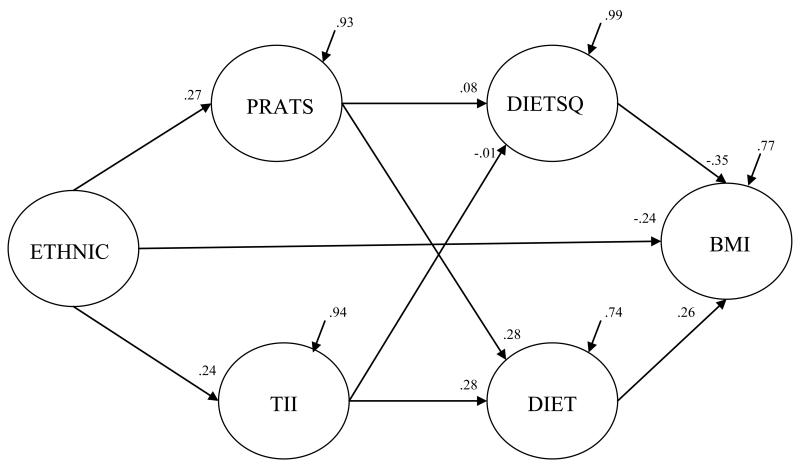
Figure 1.
Path diagram depicting the structural relations for the hypothesized model (N = 816). The numbers in the figure are standardized path coefficients; all paths were significant at p < .01 except for the paths from the perceived romantic appeal of thinness to the quadratic component of dietary restriction and thin-ideal internalization to the quadratic component of dietary restriction (which were both nonsignificant, ps > .05). Disturbances of the endogenous variables (1 – R2) convey the proportion of variance that is not accounted for by influences depicted in the model. ETHNIC = race/ethnicity, PRATS = perceived romantic appeal of thinness, TII = thin-ideal internalization, DIET = linear component of dietary restriction, DIETSQ = quadratic component of dietary restriction, BMI = body mass. Race/ethnicity was coded so that Caucasian = 1, African American = 0.

