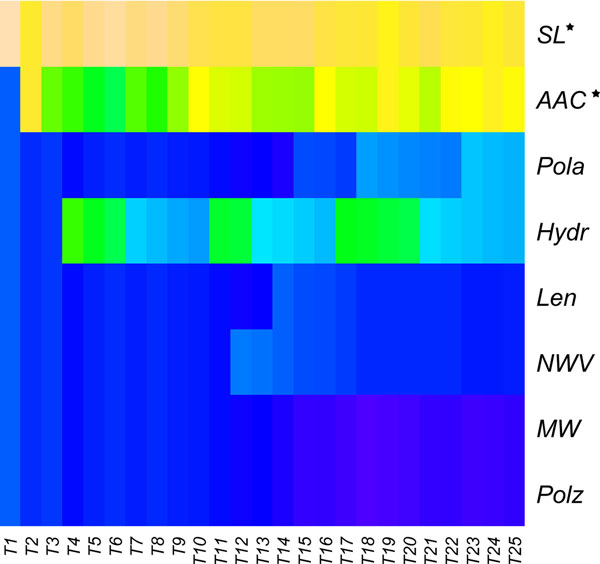
Figure 2.
The heatmap of feature compositions of different property types. The vertical axis represents the feature composition of eight types of protein properties, i.e. SL (subcellular locations), AAC (amino acid composition), Pola (polarity), Hydr (hydrophobicity), Len (length), NWV (normalized van der Waals volume), MW (molecular weight) and Polz (polarizability). While horizontal axis shows the selected numbers of top features in IFS procedure signed as Tx, in which x denotes the number features. And the warmer colour denotes the higher correlation. The properties with star (SL* and AAC*) performed remarkable.

