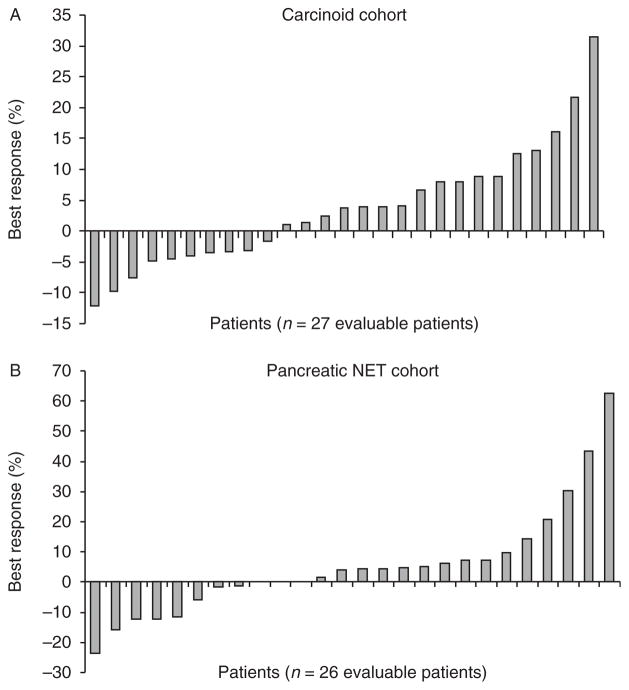
Figure 1.
Waterfall plot illustrating best radiographic response (percent change) in each patient stratified by tumor cohort. (A) Maximum percentage of reduction in sum of tumor diameters from baseline (carcinoid tumor cohort). (B) Maximum percentage of reduction in sum of tumor diameters from baseline (pancreatic NET cohort).

