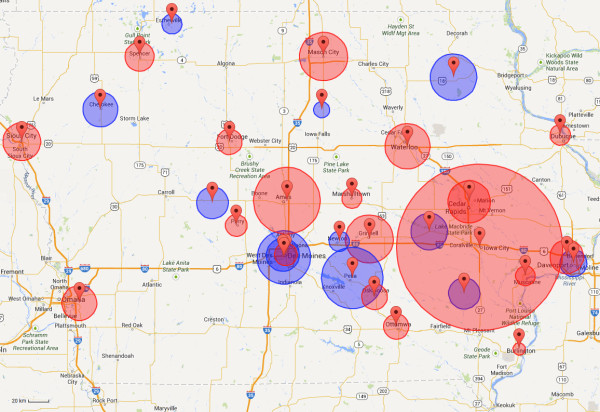
Figure 2.

Map comparing 19 existing sites against 19 sites chosen using MCM-NC. The 19 existing sites (blue circles) and 19 sites calculated using the MCM-NC (red circles) are shown together. Circles around each marker indicate the average driving distance between patient homes and provider location in the Medicaid dataset. The large red circle around Iowa City represents the University of Iowa Hospitals and Clinics; the average driving distance is 45.47 miles (73.18 kilometers). The MCM-NC tends to choose sites in the more densely populated regions in Iowa. These sites often contain more reputable hospitals and clinics, and as a result, many people are willing to drive further distances to be seen at these locations. The existing network neglects certain populous regions of Iowa (such as Council Bluffs near Omaha) while potentially over-covering other regions (such as Des Moines). Although the Medicaid dataset is used to display average driving distances in this figure, recall that only population data are used to select sites for a network.
