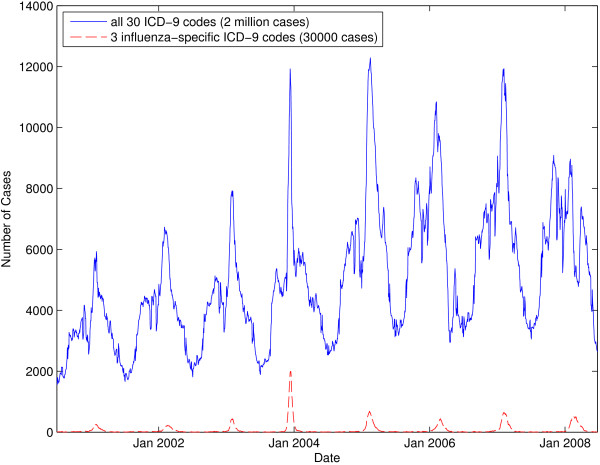
Figure 3.
Seven-day moving average graph showing the number of cases present in the Medicaid dataset over time. The top line aggregates cases for all 30 ICD-9 codes while the bottom line aggregates cases for three influenza-specific ICD-9 codes (i.e., 487.x). Note that, when using all 30 ICD-9 codes, the case count never goes to zero.

