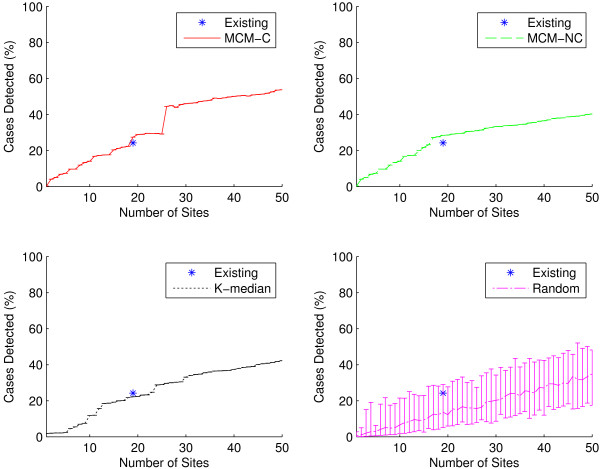
Figure 4.
Outbreak intensity as a function of network size for all ICD-9 codes. Outbreak intensity is shown for the existing sites (shown as a single data point at n = 19) as well as for sites generated using the two MCM variants, K-median model, and randomly selected sites considering all 30 ICD-9 codes. MCM-C is capacitated MCM, and MCM-NC is non-capacitated MCM. Random results at each network size were computed by selecting 50 networks uniformly at random. In all cases, because our simulations are stochastic, results were computed using 50 replicates. Graphs show average results as well as minimum/maximum error bars. In general, the two MCM variants perform best, with the K-median model trailing closely. The two MCM models outperform the existing sites. The existing sites detect approximately 24.2% (±0.02%) of all cases, while it takes only 17 sites for the MCM-NC to accomplish the same level of outbreak intensity detection. At n = 19, MCM-NC detects 28.5% (±0.02%) of all cases. As the number of sites grows beyond 20 sites, the capacitated MCM better detects outbreak intensity.

