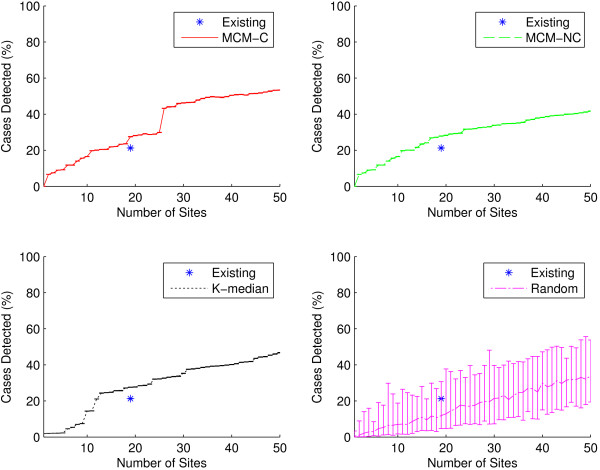
Figure 5.
Outbreak intensity as a function of network size for the influenza-specific dataset. Outbreak intensity is shown for the existing sites (shown as a single data point at n = 19) as well as for sites generated using the two MCM variants, K-median model, and randomly selected sites for the three influenza-specific ICD-9 codes. Here, all three algorithmic variants outperform the existing sites. The existing sites detect approximately 21.2% (±0.1%) of all cases. It takes only 12 sites for the K-median to accomplish the same level of outbreak intensity detection. At n = 19, MCM-NC detects 27.9% (±0.2%) of all cases.

