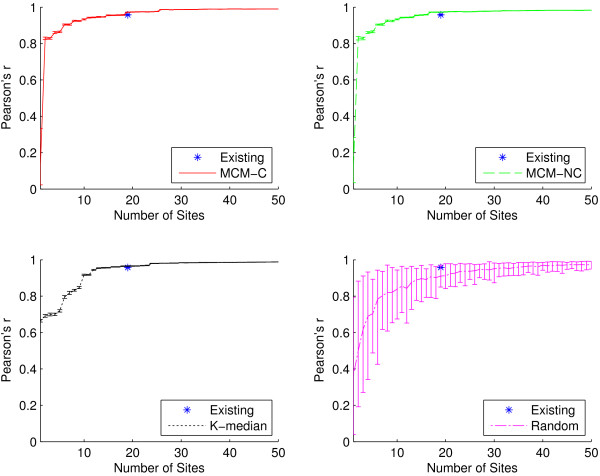
Figure 7.
Outbreak timing as a function of network size for the influenza-specific dataset. Pearson’s r for the existing sites as well as for sites generated using the two MCM variants, K-median model, and randomly selected sites for the three influenza-specific ICD-9 codes. At n=19, the average Pearson’s r for the existing sites is 0.96 (±0.01), while it is 0.97 (±0.001) for all three algorithmic placement methods and 0.91 (±0.06) for randomly placed sites. Compared to Figure 6, there is a very small reduction in outbreak timing detection capabilities when the ICD-9 codes are restricted. Both MCM variants are capable of 0.9 correlation with as few as six sites, and only 14 sites are required to match the performance of the existing network.

