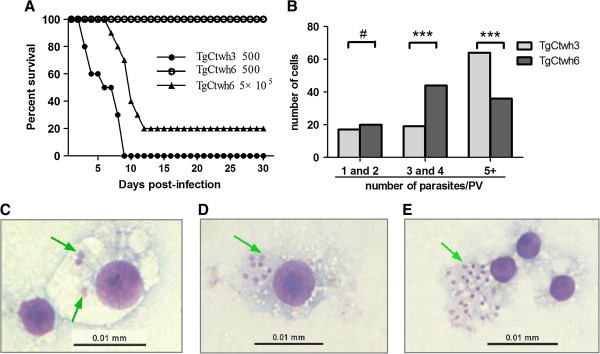
Figure 1.

Survival curve of mice infected with TgCtwh3 or TgCtwh6 and isolates’ growth in vitro. (A) Ten BALB/C mice per group were inoculated i. p. with 500 or 5×10⁵ tachyzoites of TgCtwh3 or TgCtwh6 and monitored for 30 days. (B) RAW264.7 cells were infected with TgCtwh3 (gray bars) or TgCtwh6 (dark bars) for 24 h (2:1 ratio of parasites to cells), stained with Wright-Giemsa, and parasites replication was determined by counting the number of parasites from 100 parasitophorous vacuoles by microscopy (Fisher’s exact test, ***p<0.001, #p>0.05, TgCtwh3 vs TgCtwh6). (C and D) As in (B), the growth of TgCtwh6 (C) and TgCtwh3 (D) in RAW246.7 was illustrated. (E) Tachyzoites of TgCtwh3 were released from infected RAW264.7 cells. Arrow represents tachyzoites.
