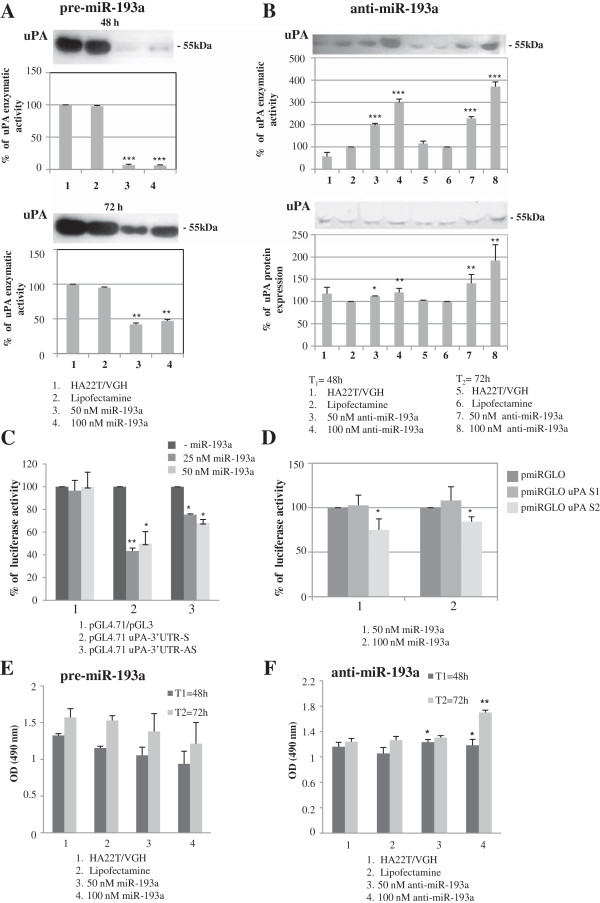
Figure 2.
Experimental validation of miR-193a as negative regulator of uPA in HA22T/VGH cells. (A) Enzymatic activity evaluated by zymography after pre-miR-193a transfection in HA22T/VGH cells. Three experiments were performed; histograms represent the mean values, bars are the SE. *p < 0.05; **p < 0.01 ***p < 0.001 versus Lipofectamine in a t-Test analysis for unpaired comparison. (B) anti-miR-193a transfection in HA22T/VGH cells causes increase of uPA protein expression and its correspondent enzymatic activity. Three experiments were performed; histograms represent the mean values, bars are the SE. *p < 0.05; **p < 0.01 ***p < 0.001 versus Lipofectamine in a t-Test analysis for unpaired comparison. (C-F) Dual-luciferase reporter assay and cellular proliferation. (C) The 3′-UTR of uPA was cloned in the pGL4.71 reporter plasmid after the Renilla luciferase CDS in sense (pGL4.71 uPA-3′ UTR-S) and antisense (pGL4.71 uPA-3′ UTR-AS) orientation. The constructs were cotransfected into HA22T/VGH cells with 0, 25 and 50 nM miR-193a mimics. Luciferase activity was normalized relative to a simultaneosly transfected firefly luciferase expression plasmid (pGL3). The construct pGL4.71 uPA-3′ UTR-S determined the inhibition of the luciferase activity, *p < 0.05; **p < 0.01 versus –miR-193a. (D) 30 nt-sequences containing the putative binding site 1 and 2 were cloned after the firefly luciferase CDS of the pmiRGLO plasmids carrying also the Renilla luciferse gene. The 2 plasmids (pmiRGLO uPA S1, pmiRGLO uPA S2) were cotrasfected with 50 nM and 100 nM miR-193a mimics in HA22T/VGH cells. Site 2 resulted in the inhibition of the luciferase activity while site 1 did not, * p < 0.05 versus pmiRGLO. (E-F) The transfection of pre-miR-193a and anti-miR-193a in HA22T/VGH cells led to a low level of proliferation inhibition and induction respectively. The histograms represent the mean of three experiments; bars are the SE. *p < 0.05; **p < 0.01 versus HA22T/VGH.

