Figure 11.

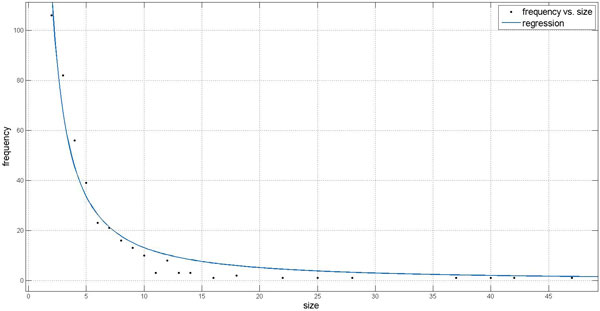
Regression curve to the frequency of sizes of the predicted clusters. The horizontal axis represents the cluster size. The vertical axis shows the frequency of clusters of a particular size.

Regression curve to the frequency of sizes of the predicted clusters. The horizontal axis represents the cluster size. The vertical axis shows the frequency of clusters of a particular size.