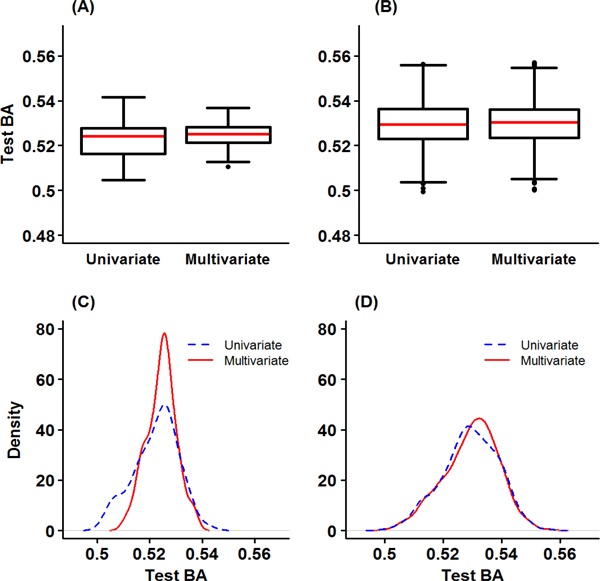
Figure 5.
Graphical descriptions for Test BA from univariate GMDR for hypertension at time 1(HP1) and multivariate GMDR for SBP and DBP. (A) Box plots of Test BA in one-locus model (B) Box plots of Test BA in two-locus model (C) Density plots of Test BA in one-locus model (D) Density plots of Test BA in two-locus model.

