
Figure 8.
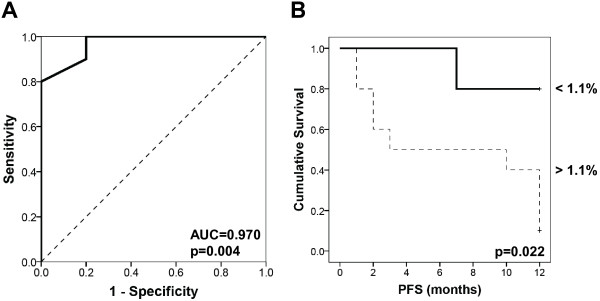
Correlation between the frequency of Treg cells and PFS in metastatic breast cancer patients. (A) ROC chart. The area under the curve served for the analysis of potentially diagnostic Treg cells’ sensitivity and specificity to assess the predictive value of Treg cells on PFS. (B) Kaplan Meier curves evaluating this possible Treg cut-off value within 12 months of follow-up.