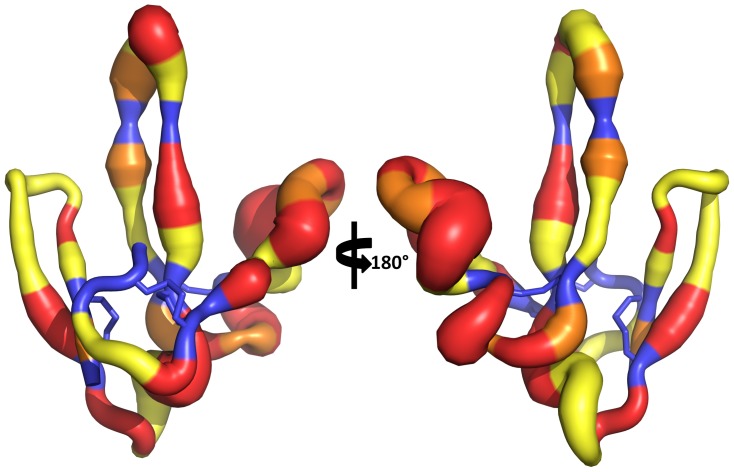
Figure 6. Rates of molecular evolution on PMF-G.
Putty model of PMF-G, with backbone width proportional to residue variability (Shannon-Weaver index in Figure 4D), and color-coded according to the likely mode of molecular evolution (based on data from Wilburn et al. [20]; backbone, black; purifying selection, blue; neutral selection, yellow; positive selection, 0.01≤p<0.05, orange; positive selection, p<0.01, red).

